APPLIED SCIENCES DEPARTMENT
Applied Sciences can be defined as the usage of scientific knowledge for practical applications like technology or inventions and it is an unexplored arena of engineering that can bring about great benefits if properly understood and applied. We at the Department of Applied Sciences aim at educating the aspirants of this branch of engineering and providing them with the theoretical as well as practical exposure that will help them excel in this particular field of engineering.
An excellent infrastructure in terms of well-equipped laboratories supported by highly qualified staff provides a conducive learning environment. Here the students have the best platform to explore themselves to excel in all domains of life. In line with the mission of MIT School of Engineering, the department propels the students to exploit their sources to the maximum and evolve as hard core professionals imbibed with the valued principles.
Q.1 How would you rate the coverage of foundational engineering concepts in the first-year curriculum?
[Note: The values in the table shows the % rating given by the respective stakeholder.]
| Stakeholders | 1. Poor | 2. Fair | 3. Average | 4. Good | 5. Excellent |
|---|---|---|---|---|---|
| Students | 2.2 | 6.1 | 22.9 | 51.2 | 17.6 |
| Teachers | 0 | 1.8 | 8.8 | 56.1 | 33.3 |
| Average | 1.1 | 4.0 | 15.9 | 53.7 | 25.5 |

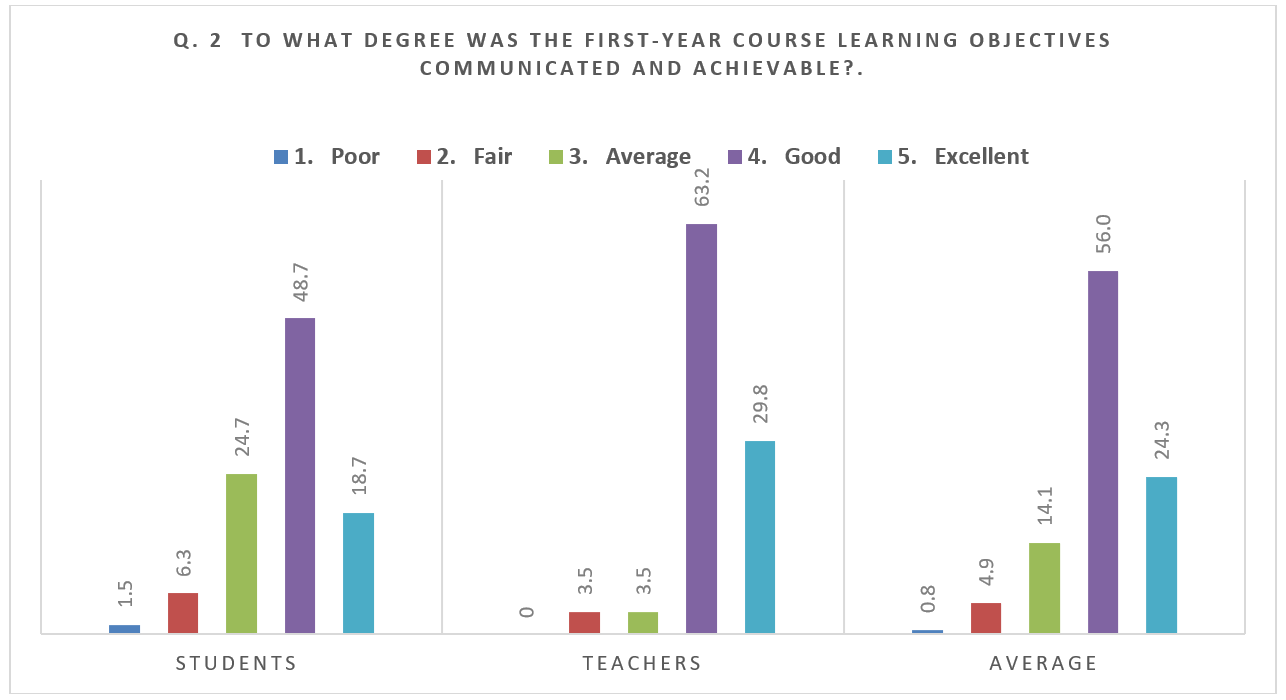
Q. 2 To what degree was the first-year course learning objectives communicated and achievable?
| Stakeholders | 1. Poor | 2. Fair | 3. Average | 4. Good | 5. Excellent |
|---|---|---|---|---|---|
| Students | 1.5 | 6.3 | 24.7 | 48.7 | 18.7 |
| Teachers | 0 | 3.5 | 3.5 | 63.2 | 29.8 |
| Average | 0.8 | 4.9 | 14.1 | 56.0 | 24.3 |
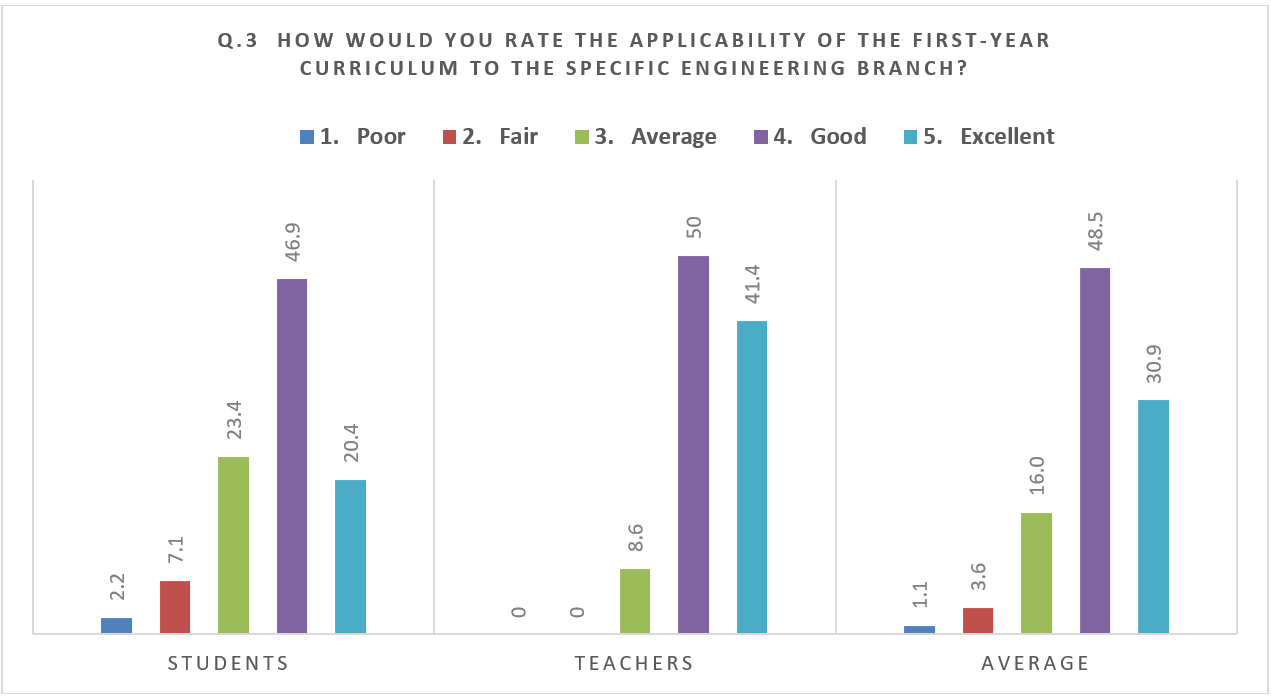
Q.3 How would you rate the applicability of the First-Year curriculum to the specific engineering branch?
| Stakeholders | 1. Poor | 2. Fair | 3. Average | 4. Good | 5. Excellent |
|---|---|---|---|---|---|
| Students | 2.2 | 7.1 | 23.4 | 46.9 | 20.4 |
| Teachers | 0 | 0 | 8.6 | 50 | 41.4 |
| Average | 1.1 | 3.6 | 16.0 | 48.5 | 30.9 |
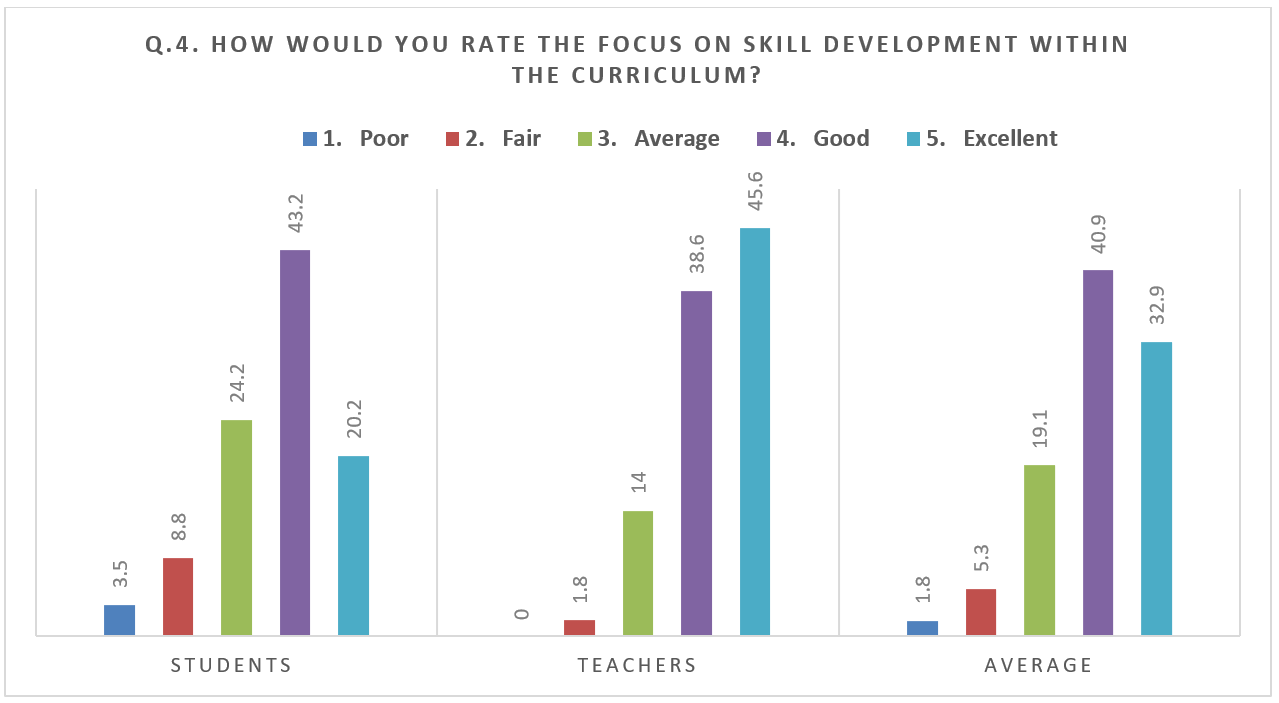
Q.4. How would you rate the focus on skill development within the curriculum?
| Stakeholders | 1. Poor | 2. Fair | 3. Average | 4. Good | 5. Excellent |
|---|---|---|---|---|---|
| Students | 3.5 | 8.8 | 24.2 | 43.2 | 20.4 |
| Teachers | 0 | 1.8 | 14 | 38.6 | 45.6 |
| Average | 1.8 | 5.3 | 19.1 | 40.9 | 32.9 |
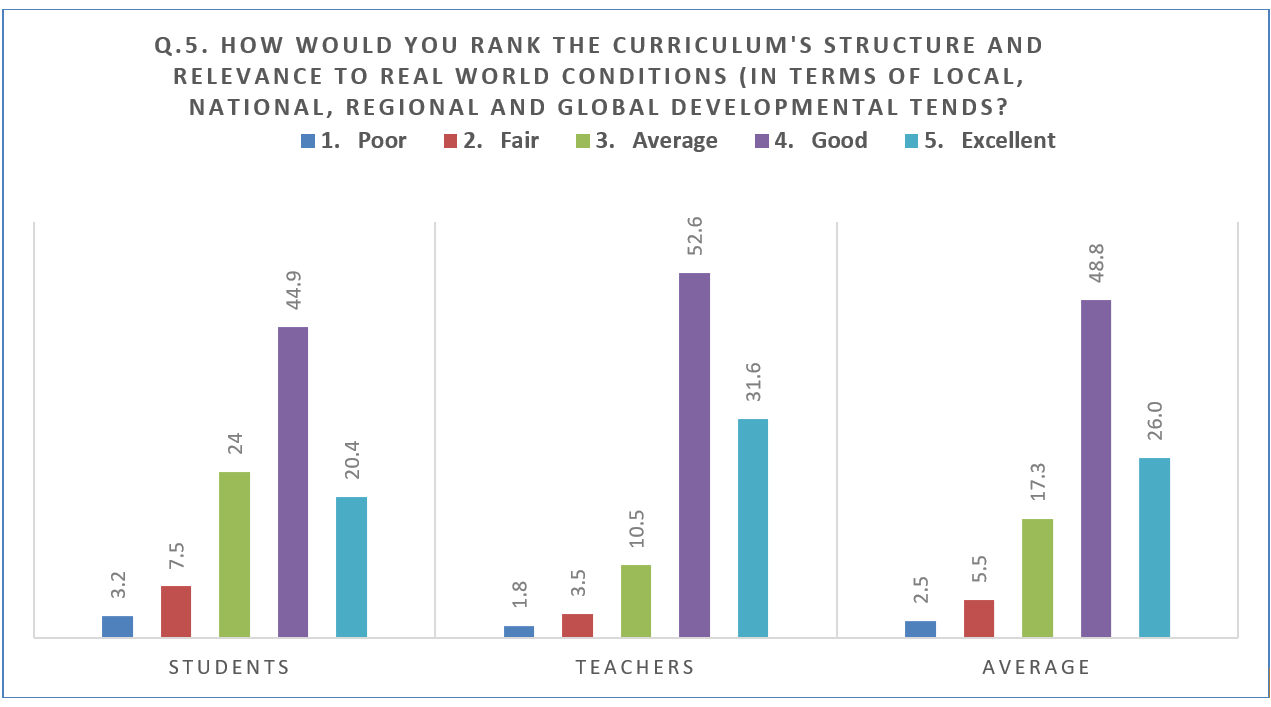
Q.5. How would you rank the curriculum's structure and relevance to real world conditions (in terms of local, national, regional and global developmental tends?
| Stakeholders | 1. Poor | 2. Fair | 3. Average | 4. Good | 5. Excellent |
|---|---|---|---|---|---|
| Students | 3.2 | 7.5 | 24 | 44.9 | 20.4 |
| Teachers | 1.8 | 3.5 | 10.5 | 52.6 | 31.6 |
| Average | 2.5 | 5.5 | 17.3 | 48.8 | 26.0 |
Average of all questions rated shared with the all stakeholders
| Stakeholders | 1. Poor | 2. Fair | 3. Average | 4. Good | 5. Excellent |
|---|---|---|---|---|---|
| Q.1 | 1.1 | 4.0 | 15.9 | 53.7 | 25.5 |
| Q.2 | 0.8 | 4.9 | 14.1 | 56.0 | 24.3 |
| Q.3 | 1.1 | 3.6 | 16.0 | 48.5 | 30.9 |
| Q.4 | 1.8 | 5.3 | 19.1 | 40.9 | 32.9 |
| Q.5 | 2.5 | 5.5 | 17.3 | 48.8 | 26.0 |
| Average | 1.44 | 4.64 | 16.46 | 49.54 | 27.90 |

| Stakeholders | 1. Poor | 2. Fair | 3. Average | 4. Good | 5. Excellent |
|---|---|---|---|---|---|
| Average | 1.44 | 4.64 | 16.46 | 49.54 | 27.90 |
